


Claris Studio: Spreadsheet View

By uLearnIT
· 588 views
Updated 23 December 2022
Claris Studio provides a range of Views for each table of data. In this article, we will look in depth at Spreadsheet View. This View packs a lot of functionality and features, so this article is quite long.
Spreadsheet View is a standard view of columns and rows that you are likely familiar with from using Excel. Generally, the following pairs of terms are used interchangeably:
- row and record
- column and field
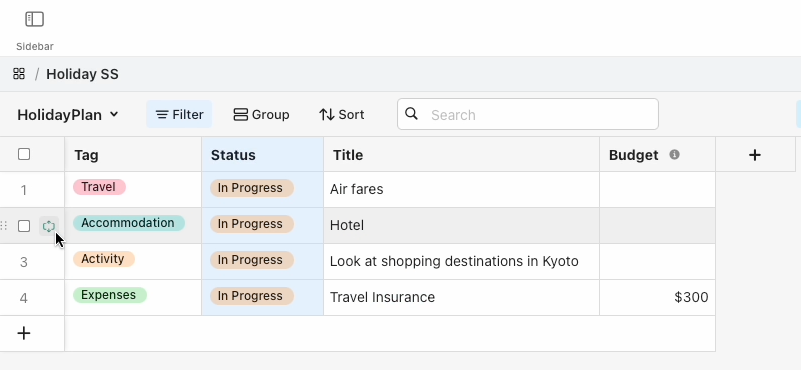
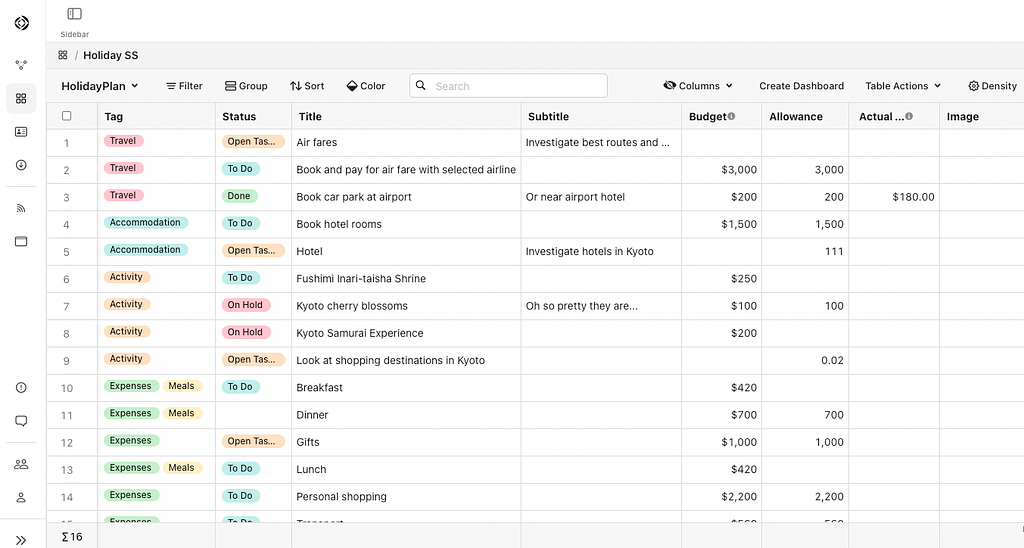 Spreadsheet view
The View has three bars above the column headers, row numbers down the side, and a summary row at the bottom.
The top (white) bar has one button — Sidebar — that toggles open the sidebar with access to Views with the Same Data and Fields (from the current table).
The second (grey) bar contains the breadcrumb for navigation. The first button (four squares) goes back to All Views. The next is the name of the current View (in this case, Holiday SS) — click to edit.
Tool Bar
The third bar down contains the majority of the tools for Spreadsheet View. The high level view of each is listed here and we will go into more detail about each below.
- Table name
- Filter — add conditions to filter the list
- Group — add a rule to group rows by a field (category)
- Sort — add a rule to sort rows
- Color — add a condition to mark rows with a color swatch
- Search — enter text to search all columns for the current rows
- Columns — show, hide and reorder columns
- Create Dashboard — create a Dashboard View with a chart
- Table Actions — Import and Download rows
- Density — setting for row height
Table Name
Click to Rename Table and Edit Description of the table. In the above screenshot, the table has been renamed HolidayPlan. The original name of a new table in Claris Studio is generic (e.g. Untitled64bd). Give every table a good descriptive name for reference outside Claris Studio (e.g. in Claris Pro).
Filter
You can reduce the number of rows displayed by applying filters. On first open, you see that the Records are not filtered with a button to Add Condition.
For a Condition, select a column, a comparison operator and (usually) specify an option.
The comparison operators are (depending on the field type):
- Is equal to, Is not equal to
- Is empty, Is not empty
- For text — Contains, Does not contain
- For numbers — Is greater than, Is greater than or equal to, Is less than, Is less than or equal to
- For dates and times — Is before, Is on or before, Is after, Is on or after, Is in the future, Is in the past
Further points to note:
- Can create multiple conditions.
- Choose if rows are displayed if all (logical AND) or any (logical OR) of the conditions are met.
- Choose to Keep Filtered — the filtered set will update as you add and edit row data, or turn off to not Filter but keep the conditions.
- Delete any condition (Trashcan icon), or Clear All.
- When Filter conditions are applied, the Filter button and relevant columns are highlighted.
- A column does not need to be displayed to be used in a Filter condition.
 Spreadsheet Filter options
Group
You can arrange the displayed rows into groups. On first open, you see that the Records are not grouped with a button to Add Rule.
For a Rule, select a column and a sort order.
Sort order depends on field type:
- Drop-down, Checkboxes, Single Choice — First-Last / Last-First (by list order)
- Other fields — Ascending / Descending
Further points to note:
- Can create multiple rules — can be re-ordered for primary and sub groups
- Choose Keep Grouped to apply the rules; or turn off to ungroup but keep the rules
- When rules are applied, the Group button and relevant columns are highlighted. The grouped columns are moved to the left of the View and are fixed in place.
- Delete any rule (Trashcan icon).
- A column must be displayed to be used in a Group Rule.
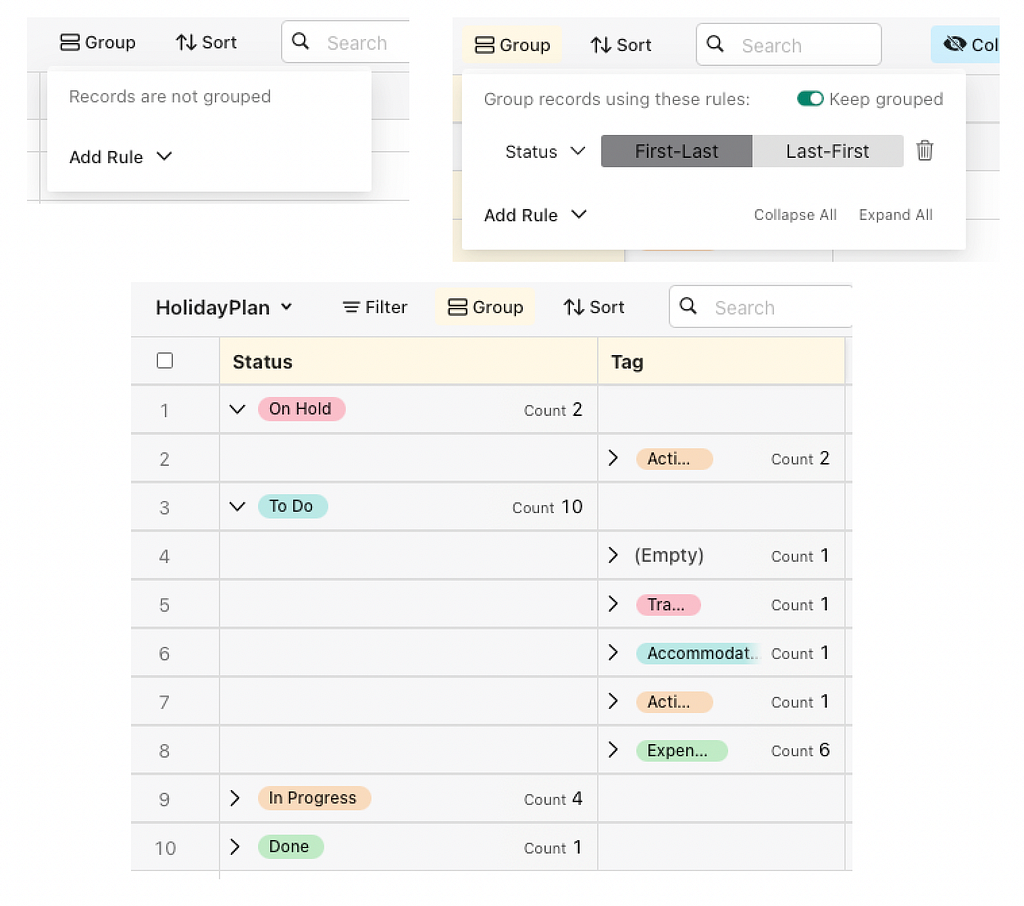 Spreadsheet Group options
When grouping is applied, each group heading row contains a Count for the group or subgroup.
Individual groups can be collapsed and expanded with the chevron > icon beside each.
There is a meatballs icon visible when you mouse over any Count — with commands for Collapse (or Expand) group, Collapse all and Expand all. Or choose Collapse All or Expand All in the Group settings.
 Collapse/expand groups
Thought bubble: I am not sure if the meatballs menu should contain Collapse/Expand group. It is two clicks to use it there versus one click to use the chevron icon on the left. Also question the validity of hiding the menu under the Count.
Sort
You can sort the rows displayed by applying rules. On first open, you see that the Records are not sorted with a button to Add Rule.
For a Rule, select a field and a sort order.
The sort orders are as for Grouping:
- Drop-down, Checkboxes, Single Choice — First-Last / Last-First (by list order)
- Other fields — Ascending / Descending
Further points to note:
- Can create multiple rules — can be re-ordered for sort levels e.g. sort by Tag then Title
- Choose Keep Sorted to apply the rules continuously — when rules are applied, the Sort button and relevant columns are highlighted.
- If Keep Sorted is off, you retain the rules and can use the Sort Now button for a temporary sort.
- Delete any rule (Trashcan icon).
- A column does not need to be displayed to be used in a Sort Rule.
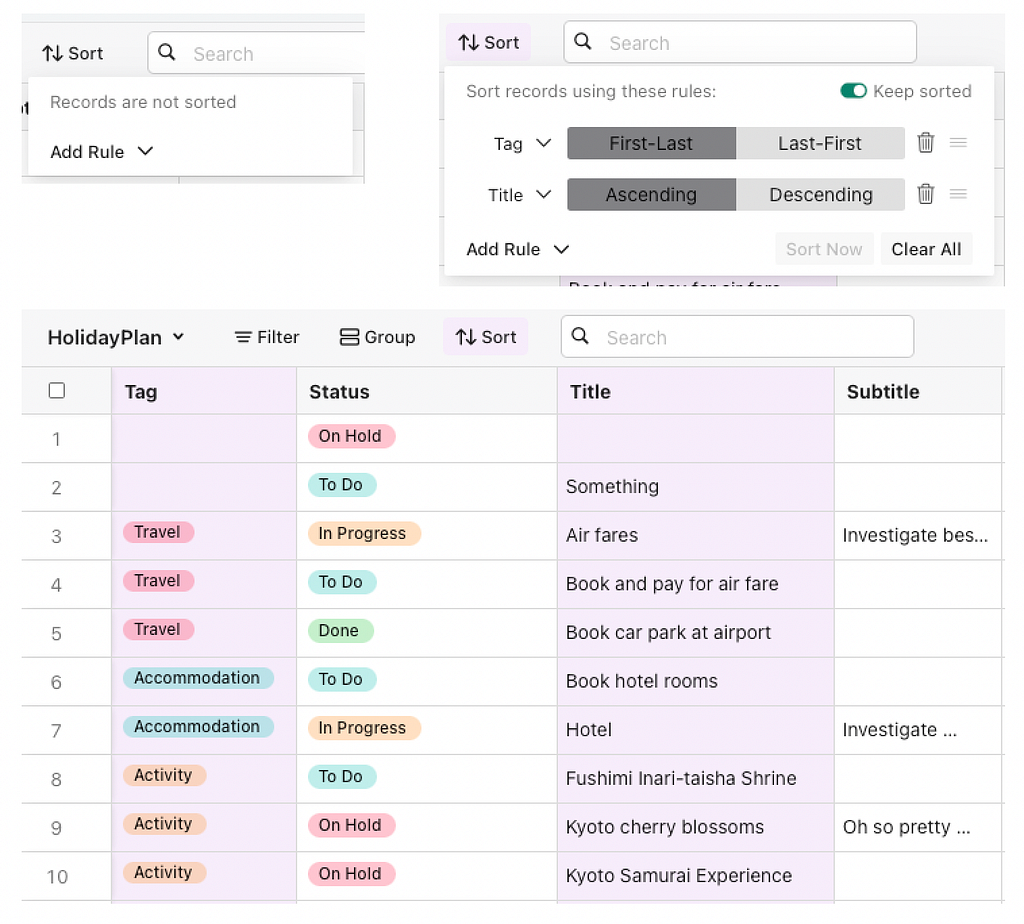 Spreadsheet Sort options
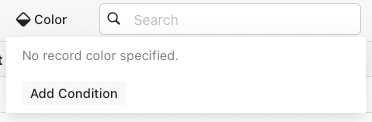
Color
You can mark rows that match a condition with a color swatch in the row number header. On first open, you see that there is No record color specified with a button to Add Condition.
For a Condition, select a column, a comparison operator and (usually) specify an option.
The comparison operators are (depending on the field type):
- Is equal to, Is not equal to
- Is empty, Is not empty
- For text — Contains, Does not contain
- For numbers — Is greater than, Is greater than or equal to, Is less than, Is less than or equal to
- For dates and times — Is before, Is on or before, Is after, Is on or after, Is in the future, Is in the past
Further points to note:
- Can create multiple conditions — can be re-ordered and deleted
- Each condition can contain multiple sub-conditions — can be set to show color if All or Any of the conditions are met
- If two conditions are true for a row, the first one wins and that color is displayed
- Can choose a color for each condition (two conditions can have the same color)
- Delete any condition or sub-condition (Trashcan icon)
- A column does not need to be displayed to be used in a Condition.
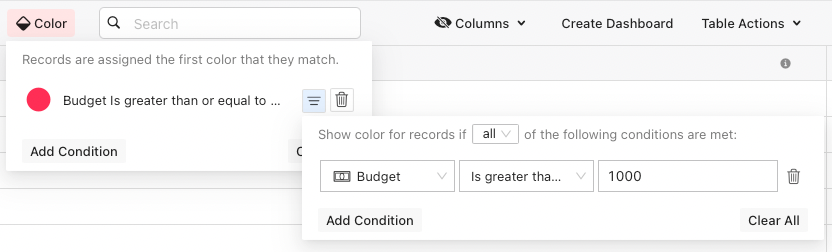 Add condition — column, comparison operator, option
 Select color for condition
 Multiple color conditions and multiple sub-conditions
 Colors applied to rows 2 and 4 according to conditions
Search
The Search box allows for a ‘field content contains’ search of all visible data.
When the search is applied, cells containing the string and the row number for each row will be highlighted. The number of found instances is shown in the search bar e.g. 1 of 4. There are chevron icons to jump between the cells containing the found instances. Use the x button to clear the search.
 Search results highlighted
Columns
Toggle the control to show and hide columns in Spreadsheet View. The Columns option also allows you to easily reorder the columns across the screen by dragging the reorder icon (three lines) up or down.
There is a button to Show All (if any columns are hidden) or Hide All (if all columns are shown).
Tip: If you want to show most of the columns, Show All then turn off the columns you want to hide; if you want to hide most of the columns, Hide All then turn on the columns you want to show.
If you have a lot of fields, there is a Find a field search tool to reduce the list. This works on a ‘field name contains’ rule e.g. a search for m will return the Image, Comments and Number columns.
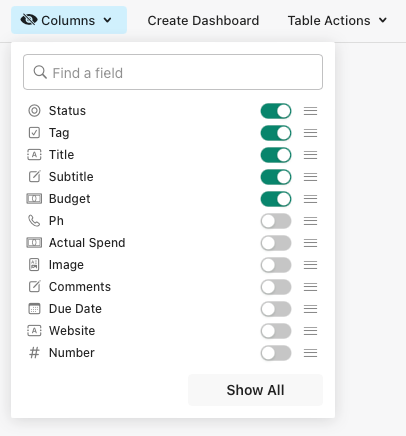 Spreadsheet show/hide and reorder columns
Create Dashboard
Spreadsheet View currently provides the only place you can create a Dashboard View for a table. The Create Dashboard button opens a Create Dashboard with Chart dialog.
To create a Dashboard:
- select a chart — Bar, Line or Pie
- select a field for the X-axis and optionally for the Y-axis
- click the Create Dashboard button
We will look into Dashboards in more detail in a future article.

Table Actions
Table Actions are for import and export of table data. The only file format recognised by Claris Studio is CSV(comma separated values).
On Import from CSV, you are prompted to Click (to select) or drag a CSV file here. In the field matching dialog that follows, choose which fields to import and match them with existing field names (first row) in the csv file. There is feature to preview the data in the import file.
The Import from CSV dialog has a checkbox for Create a new spreadsheet. This will create a new Spreadsheet View and a completely new table.
 CSV import process
Thought bubble: There is a curious limit of just 50 records for import. Presumably this limit will be removed in future. Testing shows that importing from a 200 row CSV imports the first 50 records.
For Download as CSV, Claris Studio downloads a file to the web browser downloads location. The file will contain the current set of records (by Filter), in the current sort order and containing the currently displayed columns in order. Grouping summaries are not exported.
Density
This is a simple choice to determine row height:
- Compact — one line
- Medium — two lines
- Comfortable — four lines
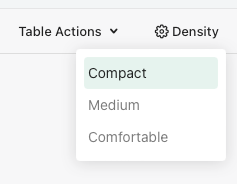
Thought bubble: Not sure about any of the terminology used there. Why not just call it Row Height and give an open choice of number of lines? The cogwheel icon is a strange choice.
Data Area
For want of a better name, I am calling the rest of the screen below the toolbar, the Data Area. It consists of:
- row numbers (left)
- column headers (top)
- summary row (bottom)
- data in cells
 Spreadsheet Data Area — column headers, row numbers, summary row, data cells
Row Numbers
The row numbers down the left are just that — a number on each row. They are not record numbers. When a spreadsheet is grouped, the group summaries are numbered rows too. The row numbers simply number the visible rows in order.
 Mouse over row number
On mouse over the row number, there are three buttons revealed:
- reorder — (six dots) manually reorder rows by dragging up and down
- select — (checkbox) select row for reordering or deleting multiple (selected) rows
- expand — (box with two arrows) open the row in a form window for editing
There is also a checkbox at the top of the row numbers for selecting all rows (or deselecting all when all are selected).
There is a + at the bottom of the row numbers to create a new row. This can also be done by clicking in the white space below the last row.
When the row is expanded for editing, the window provides access to all visible fields and also to hidden fields. There is a button to Add New Field to the table. Navigation buttons at the top left allow you to go to the previous and next row in the list without closing the window. Click the Close button (x top right) or click outside the window to close. As with editing data directly in a row, edited data is saved automatically — there is no explicit Save or Undo/Revert.
 Expand record for editing
Column Headers
The column headers across the top of the data area show the column/field names. There is hidden functionality in these column headers.
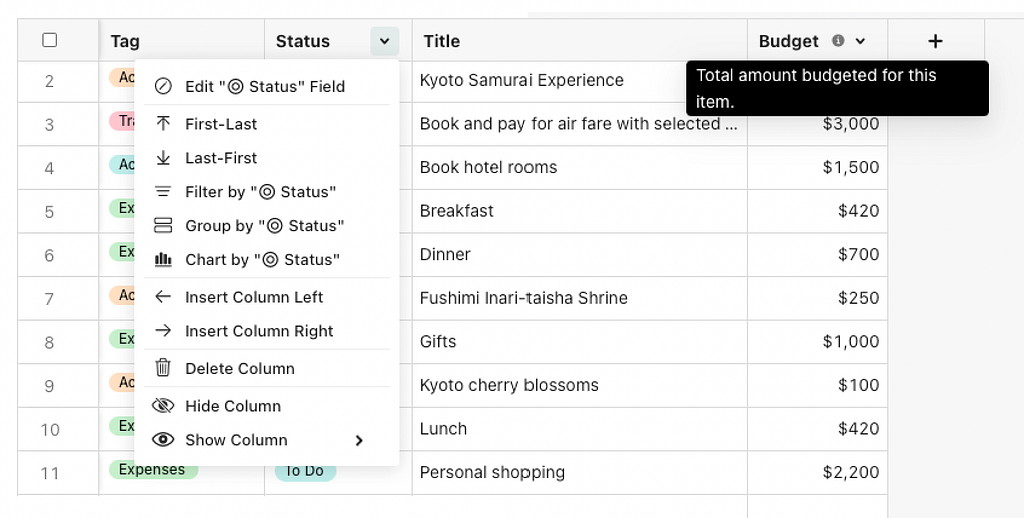 Column header options
For each column, there is a downward chevron icon on mouse over that reveals an extensive menu:
- edit the field
- sort, filter, group and chart by the field
- insert column (add a field) left or right
- delete column (field and all data, from table)
- freeze column (see below)
- hide column, show hidden columns
If entered for a field, there will be an i icon which can be moused over to show the field description (see the Budget field above). Click the icon to edit the field description.
Edit a field by choosing the command from the column header menu or by double-clicking the name in the column header. This will allow editing of the column name, setting any field options, and adding or editing the description. It also shows the field type — this cannot be changed for an existing field.
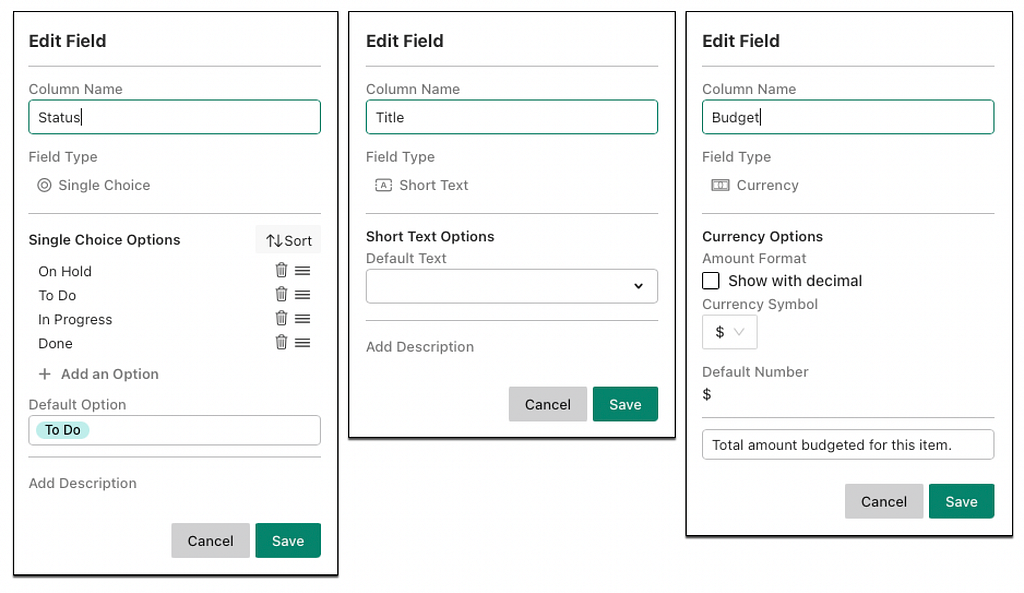 Edit Field for Single Choice, Short Text and Currency fields
Columns may be:
- reordered across the screen by dragging the column header.
- resized by positioning the mouse at the right of the column header and dragging; or double-click the right of the column header to auto-resize to the longest content.
- frozen by selecting one or more columns and selecting Freeze Column or Freeze Selected Columns from the column header menu. This will move the columns to the left and freeze them in position while you scroll to the right.
 Freeze selected columns
At the time of writing, there is a bug with the Safari browser — the column resize icon does not display. But the column resize still works.
At the right of the last displayed column is a + icon used to add a new column to the table. Click and select a field type, then specify the name, type, options and description.
Summary Row
The summary row is at the bottom of the screen. There is a summary cell for each column.
The summary cell below the row numbers displays the total record count (e.g. ∑6).
Mathematicians may be amused by the use of the incorrect symbol here — ∑ means ‘the sum of’ not ‘the count of’. Perhaps it should be #6.
Each column summary cell has options dependent on the field type. You can select one option by clicking on the summary cell. The result will be displayed with a label.
If the rows are grouped, each group row also displays the column summaries selected.
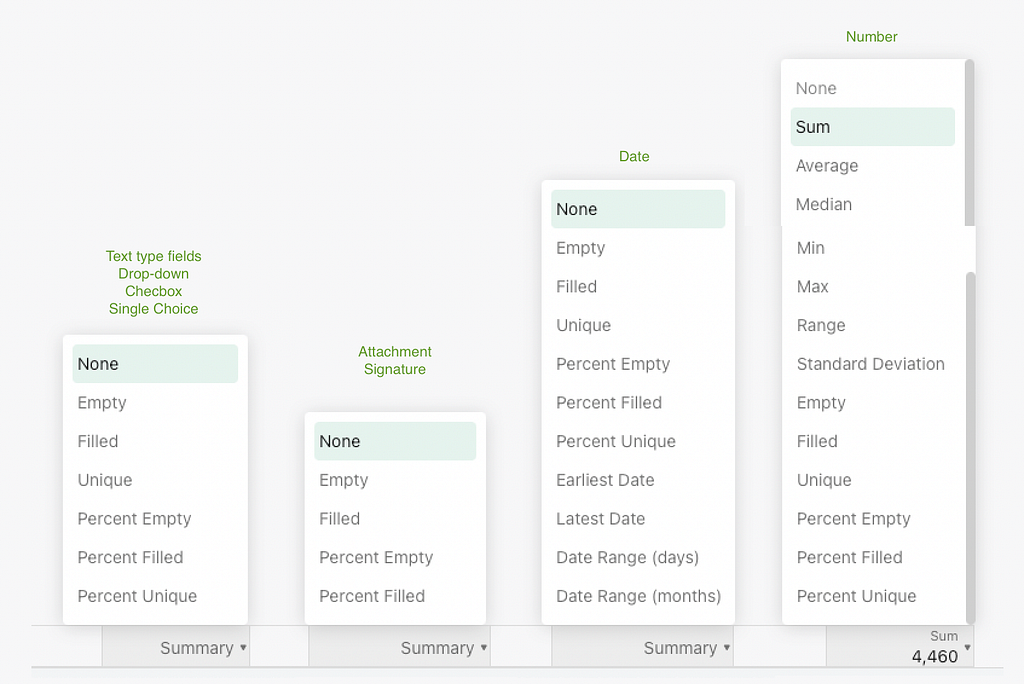 Summary cell options by field type
The summary options provided are reasonably obvious and do not need individual explanation here.
Data in Cells
Each column for each row creates a cell intersection where data is displayed. Data is formatted according to selected field options.
Where the field is a choice (Drop-down, Checkboxes, Single Choice), the data is displayed as a coloured pill for each choice. There is currently no control over the colours used.
Click in a cell to edit data. There is some variability in the techniques required here. Sometimes it may need a double-click to begin editing, to select some contents, or to display a list or calendar.
Moving to the next cell is normally achieved with the tab key (and back with Shift-tab). However there are anomalous times when the tab key moves out of the browser window. This may be a bug to be fixed.
Fill Down
Cells provide a “fill down” (or up) function. An active cell has a green square in the lower right corner. When you point to this square, it grows and the cursor changes to a four-headed arrow. Then you can drag up or down to fill the current cell contents to adjacent rows.
Be warned — there is no check or warning if you fill down over existing data. Claris Studio will simply overwrite the existing data as soon as the mouse is released, and there is no undo available.
Fill Down is not available if rows are grouped.
Expand Field
Some cells have an Expand Field option when the field is active. The icon is the same as Expand Row in the row number column. This option opens a new window for editing the cell contents. This is available for Long Text and Checkboxes fields.
 Expand Field option
Context Menu
There is a context menu (Ctrl-click or Right-click) available anywhere in a row. It has commands for:
- Add Record Above
- Add Record Below
- Duplicate Record
- Delete Record (Delete Selected Records if multiple records selected)
- Expand Record
Certain commands are greyed out when not applicable e.g. Duplicate record when multiple records are selected, Add Record Above/Below when a Filter is active.
Anything Else?
You can see there are a lot of features in Spreadsheet View to manage your table, control the display and the data contained in rows and columns. Bear in mind that some features may not be available all the time depending on the current state of the view.
This article details a lot of hidden features and tips for using Spreadsheet View. There are likely some that I have not found yet! Feel free to add a comment if you know of any more.
Claris Studio: Spreadsheet View was originally published in Discover the Claris platform on Medium, where people are continuing the conversation by highlighting and responding to this story.
Recommended Comments